
To calculate repeat-customer rate from an order export, first count the distinct customers who bought in your reporting window. Then count how many of those customers placed two or more orders in that window, and divide by the first number. Divide by customers, not order rows.
In the April example below, 4 customers placed 5 orders, and 1 of them ordered twice in April: 1 ÷ 4 = 25% repeat rate. A related metric, the returning-customer rate, also counts purchases from before the window. By April 30, 2 of the 4 had ordered at least twice in total: 2 ÷ 4 = 50% returning rate. A common mistake is dividing by order rows instead (2 ÷ 5 = 40%), which gives the wrong answer for either metric.
Below is the export I made up for this article.
| order_id | customer_name | order_date | net_sales_usd |
|---|---|---|---|
| ORD-6401 | Apex Dental Supply | 2026-02-14 | 1,200 |
| ORD-6402 | Harborview Catering | 2026-03-10 | 1,100 |
| ORD-6403 | Pinecrest Bakery | 2026-03-22 | 1,100 |
| ORD-6404 | Apex Dental Supply | 2026-04-04 | 1,500 |
| ORD-6405 | Harborview Catering | 2026-04-09 | 1,400 |
| ORD-6406 | Northstar Pet Clinic | 2026-04-15 | 900 |
| ORD-6407 | Apex Dental Supply | 2026-04-21 | 1,300 |
| ORD-6408 | Summit HVAC Services | 2026-04-28 | 1,100 |
From that export, each calculation comes out like this:
| Calculation | Numerator | Denominator | Rate | Audit result |
|---|---|---|---|---|
| Within-window repeat rate | 1 customer | 4 April customers | 25.00% | Reconciled |
| Returning-customer rate | 2 customers | 4 April customers | 50.00% | Reconciled |
| Trap 1: whole export, no April filter | 2 customers | 5 customers | 40.00% | Window mismatch |
| Trap 2: order rows as the denominator | 2 repeat orders | 5 April orders | 40.00% | Denominator grain mismatch |
| Trap 3: repeat orders counted, not repeat customers | 2 repeat orders | 4 April customers | 50.00% | Numerator not deduplicated |
| Trap 4: returning count reported as within-window | 2 customers | 4 April customers | 50.00% | Wrong definition |
Why the Order Export Gives the Wrong Answer
An order export has one row per order. Repeat-customer rate has one unit per customer. If you divide without changing grain, you’re answering a different question. See What Does One Row Represent in Your Sales Spreadsheet?
I’ve seen numbers that should agree fall out of sync plenty of times. A repeat rate built at the wrong grain is one of the quiet ways it happens, because every cell looks reasonable.
Take April in the example. Five orders came from four customers. Apex Dental Supply placed two of them. If you divide repeat order rows by all order rows, you get 2 / 5 = 40%. That is the share of orders placed by repeat buyers, not the share of customers who came back.
The second mistake divides the same two repeat orders by the four customers, which gives 50%. The giveaway is that the parts no longer add up. Two “repeat customers” plus three one-time customers make five, but only four customers bought in April.
Pick One Definition Before You Write a Formula
Even with clean counting, two reasonable questions give different answers:
- Within-window repeat rate: of the customers who ordered in April, how many placed two or more orders in April? Only Apex did, so 1 / 4 = 25%.
- Returning-customer rate: of the customers who ordered in April, how many had placed two or more orders in total by April 30? Apex (one February order plus two in April) and Harborview Catering (one March order plus one in April) both qualify, so 2 / 4 = 50%.
Harborview is the whole 25-point difference. It’s a one-time customer in April and a returning customer overall.
The returning definition has two limits. First, it only sees orders in the file. If a customer’s earlier order was in 2024 and your export starts in 2026, the sheet can’t see it, so that customer looks like a one-time buyer. Customers with two orders in the file are still counted correctly. To avoid undercounting the rest, export older orders too, up to the end of the window. Second, it counts any customer with two orders by the window end, even if both fell inside the window. Some teams call a customer “returning” only if they ordered before the window started. That is a third definition. In this example, it also gives 50%, but it won’t on other data. Write the definition you use in the report header.
What about a good target? I wouldn’t pretend to generalize about that. You’d have to look at what the business sells and how its customers buy first. A dental practice may reorder consumables often. An HVAC customer may replace equipment only every several years. A 30-day window and a 365-day window also give very different rates.
This metric counts each customer once, whatever they spend. Apex is 25% of April customers, 40% of April orders, and 45.16% of April sales. How much revenue depends on your biggest customers is a separate question. So is what share of a starting group of customers buys again in later months (cohort retention).
Step 1: Set Up the Export and Check Every Row
Create a tab called Order_Export. Put the headings order_id, customer_id, customer_name, order_date, and net_sales_usd in A1:E1, and the eight orders in rows 2 to 9. Enter the dates as real dates, not text.
| Row | order_id (A) | customer_id (B) | customer_name (C) | order_date (D) | net_sales_usd (E) |
|---|---|---|---|---|---|
| 2 | ORD-6401 | CUST-201 | Apex Dental Supply | 2026-02-14 | 1200 |
| 3 | ORD-6402 | CUST-202 | Harborview Catering | 2026-03-10 | 1100 |
| 4 | ORD-6403 | CUST-205 | Pinecrest Bakery | 2026-03-22 | 1100 |
| 5 | ORD-6404 | CUST-201 | Apex Dental Supply | 2026-04-04 | 1500 |
| 6 | ORD-6405 | CUST-202 | Harborview Catering | 2026-04-09 | 1400 |
| 7 | ORD-6406 | CUST-203 | Northstar Pet Clinic | 2026-04-15 | 900 |
| 8 | ORD-6407 | CUST-201 | Apex Dental Supply | 2026-04-21 | 1300 |
| 9 | ORD-6408 | CUST-204 | Summit HVAC Services | 2026-04-28 | 1100 |
The export totals $9,600. April alone is $6,200.
Before you use your own export, confirm that one row really is one order. Shopify’s order CSV puts additional line items on separate lines, so a three-item order takes three rows. Collapse line items to one row per completed order first. Duplicate sales rows or legitimate order lines? shows how to tell the difference. Also remove canceled orders, $0 replacements, and refund rows. Each row here is a completed order with positive sales.
Many exports also carry a time with the date, such as 2026-04-28 14:22. Convert those to whole dates with INT, or use a date-only column. If dates came in as text, see fix date locale before building a monthly report.
Put Row_Check in F1. Enter this in F2 and copy it down to F9:
=IF(OR(COUNTA(A2:E2)<5, NOT(ISTEXT(A2)), NOT(ISTEXT(B2)), NOT(ISTEXT(C2)), TRIM(SUBSTITUTE(A2, CHAR(160), " "))="", TRIM(SUBSTITUTE(B2, CHAR(160), " "))="", TRIM(SUBSTITUTE(C2, CHAR(160), " "))="", NOT(EXACT(A2, TRIM(SUBSTITUTE(A2, CHAR(160), " ")))), NOT(EXACT(B2, TRIM(SUBSTITUTE(B2, CHAR(160), " ")))), NOT(EXACT(C2, TRIM(SUBSTITUTE(C2, CHAR(160), " ")))), LEN(A2)<>8, NOT(EXACT(LEFT(A2, 4), "ORD-")), NOT(ISNUMBER(FIND(MID(A2, 5, 1), "0123456789"))), NOT(ISNUMBER(FIND(MID(A2, 6, 1), "0123456789"))), NOT(ISNUMBER(FIND(MID(A2, 7, 1), "0123456789"))), NOT(ISNUMBER(FIND(MID(A2, 8, 1), "0123456789"))), LEN(B2)<>8, NOT(EXACT(LEFT(B2, 5), "CUST-")), NOT(ISNUMBER(FIND(MID(B2, 6, 1), "0123456789"))), NOT(ISNUMBER(FIND(MID(B2, 7, 1), "0123456789"))), NOT(ISNUMBER(FIND(MID(B2, 8, 1), "0123456789"))), NOT(ISNUMBER(D2)), NOT(ISNUMBER(E2))), "CHECK INPUTS", IF(OR(D2<DATE(2000,1,1), INT(D2)<>D2, E2<=0, SUMPRODUCT(--(UPPER($A$2:$A$9)=UPPER(A2)))>1, SUMPRODUCT(--EXACT($B$2:$B$9, B2), --NOT(EXACT($C$2:$C$9, C2)))>0, SUMPRODUCT(--(UPPER($C$2:$C$9)=UPPER(C2)), --NOT(EXACT($B$2:$B$9, B2)))>0), "CHECK INPUTS", "OK"))
All eight rows should say OK. A row returns CHECK INPUTS if any of these is true:
- A cell is blank, or has extra or non-breaking spaces.
- An ID doesn’t follow this example’s ORD- plus four digits or CUST- plus three digits format.
- The date is text, has a time attached, or is before 2000.
- The amount is zero or negative.
- The order ID appears twice. An uncollapsed line-item export fails here, on every repeated row.
- One customer ID has two names, or one name has two customer IDs.
If a guest checks out with a different email, the platform may create a second customer ID for the same business. WooCommerce links guest orders placed with the same email address to one customer record. When the email differs, nothing links the two orders, and one customer is counted as two.
The check only catches conflicts it can see. If a duplicate account has both a different ID and a different name, both rows pass. Review new customer IDs against your customer list as well.
Step 2: Flag Each Active Customer Once
Set the reporting window first. Put Check_Item, Within_Window_Benchmark, Returning_Window_Benchmark, and Candidate_KPI_Audit in K1:N1. In K2:K13, enter Repeat_Definition, Window_Start, Window_End, Window_Order_Rows, Window_Net_Sales_USD, Distinct_Active_Customers, Distinct_Repeat_Customers, Distinct_OneTime_Customers, Repeat_Customer_Rate, Rate_Gap_Percentage_Points, Denominator_And_Count_Gap, and Reconciliation_Status. Then:
- L2 =
WITHIN_WINDOW, L3 = 2026-04-01, L4 = 2026-04-30 - M2 =
RETURNING_EXPORT, M3 = 2026-04-01, M4 = 2026-04-30 - N2 =
NOT TESTED, with N3:N10 left blank
Enter the dates in L3:M4, and later N3:N4, as real dates, the same as column D.
Put In_Window_First_Customer in G1. In G2, copied down to G9:
=IF(OR(NOT(EXACT(F2, "OK")), COUNTIF($F$2:$F$9, "OK")<8, NOT(ISNUMBER($L$3)), NOT(ISNUMBER($L$4))), "CHECK INPUTS", IF(OR($L$3<DATE(2000,1,1), INT($L$3)<>$L$3, $L$4<DATE(2000,1,1), INT($L$4)<>$L$4, $L$4<$L$3), "CHECK INPUTS", IF(AND(D2>=$L$3, D2<=$L$4, SUMPRODUCT(--EXACT($B$2:B2, B2), --($D$2:D2>=$L$3), --($D$2:D2<=$L$4))=1), 1, 0)))
The range $B$2:B2 grows as you copy it down. In each row, it looks only at that row and the rows above it. A row gets a 1 when it is inside the window and is the first in-window row for that customer. Apex’s April 4 order in row 5 gets the 1, and its April 21 order in row 8 gets a 0. Sort order doesn’t matter. With newest orders first, the 1 lands on a different row, but each customer still gets exactly one.
Put Within_Window_Repeat_Customer in H1. In H2, copied down to H9:
=IF(OR(NOT(ISNUMBER(G2)), COUNT($G$2:$G$9)<8), "CHECK INPUTS", IF(AND(G2=1, SUMPRODUCT(--EXACT($B$2:$B$9, B2), --($D$2:$D$9>=$L$3), --($D$2:$D$9<=$L$4))>=2), 1, 0))
Put Returning_Customer_In_Window in I1. In I2, copied down to I9:
=IF(OR(NOT(ISNUMBER(G2)), COUNT($G$2:$G$9)<8), "CHECK INPUTS", IF(AND(G2=1, SUMPRODUCT(--EXACT($B$2:$B$9, B2), --($D$2:$D$9<=$L$4))>=2), 1, 0))
Column H flags each active customer who has at least two orders inside the window. Column I flags each active customer who has at least two orders up to the window end. Because column I stops at the window end, a later order can’t leak into an earlier period.
| Row | order_id | customer_id | G | H | I |
|---|---|---|---|---|---|
| 2–4 | ORD-6401 to ORD-6403 | (February and March) | 0 | 0 | 0 |
| 5 | ORD-6404 | CUST-201 | 1 | 1 | 1 |
| 6 | ORD-6405 | CUST-202 | 1 | 0 | 1 |
| 7 | ORD-6406 | CUST-203 | 1 | 0 | 0 |
| 8 | ORD-6407 | CUST-201 | 0 | 0 | 0 |
| 9 | ORD-6408 | CUST-204 | 1 | 0 | 0 |
The matching uses SUMPRODUCT with EXACT, not COUNTIFS. COUNTIF is not case-sensitive and treats ? and * as wildcards, so it can match IDs that aren’t the same. EXACT compares every character. The COUNTIF($F$2:$F$9, "OK") in G2 and L5 is safe, because it looks for a fixed status word with no wildcard characters.

Step 3: Build the Reconciliation Block
Column L computes the within-window benchmark. In L5:
=IF(OR(NOT(EXACT(L2, "WITHIN_WINDOW")), NOT(ISNUMBER(L3)), NOT(ISNUMBER(L4)), COUNTIF($F$2:$F$9, "OK")<8, COUNT($G$2:$G$9)<8, COUNT($H$2:$H$9)<8, COUNT($I$2:$I$9)<8), "CHECK INPUTS", IF(OR(L3<DATE(2000,1,1), INT(L3)<>L3, L4<DATE(2000,1,1), INT(L4)<>L4, L4<L3, SUM($G$2:$G$9)<=0), "CHECK INPUTS", SUMPRODUCT(--($D$2:$D$9>=L3), --($D$2:$D$9<=L4))))
Then L6 to L12:
- L6:
=IF(NOT(ISNUMBER(L5)), "CHECK INPUTS", ROUND(SUMPRODUCT(--($D$2:$D$9>=L3), --($D$2:$D$9<=L4), $E$2:$E$9), 2)) - L7:
=IF(NOT(ISNUMBER(L5)), "CHECK INPUTS", SUM($G$2:$G$9)) - L8:
=IF(NOT(ISNUMBER(L5)), "CHECK INPUTS", SUM($H$2:$H$9)) - L9:
=IF(NOT(ISNUMBER(L5)), "CHECK INPUTS", L7-L8) - L10:
=IF(NOT(ISNUMBER(L5)), "CHECK INPUTS", ROUND(L8/L7, 4)) - L11 and L12:
=IF(NOT(ISNUMBER(L5)), "CHECK INPUTS", 0)
L11 and L12 hold zero because the benchmark can’t differ from itself. They keep the rows lined up with the audit column. L13 writes the status:
=IF(OR(NOT(ISNUMBER(L5)), NOT(ISNUMBER(L6)), NOT(ISNUMBER(L7)), NOT(ISNUMBER(L8)), NOT(ISNUMBER(L9)), NOT(ISNUMBER(L10)), NOT(ISNUMBER(L11)), NOT(ISNUMBER(L12))), "CHECK INPUTS", IF(OR(L11<>0, L12<>0, L8+L9<>L7, L8<0, L9<0), "CHECK INPUTS", "RECONCILED: " & TEXT(L10, "0.00%") & " WITHIN-WINDOW (" & L8 & " OF " & L7 & " CUSTOMERS / " & L5 & " ORDERS / $" & TEXT(L6, "0.00") & ")"))
For column M, enter this in M5. It also requires M’s dates to match L’s:
=IF(OR(NOT(EXACT(M2, "RETURNING_EXPORT")), NOT(ISNUMBER(M3)), NOT(ISNUMBER(M4)), NOT(ISNUMBER(L5))), "CHECK INPUTS", IF(OR(M3<DATE(2000,1,1), INT(M3)<>M3, M4<DATE(2000,1,1), INT(M4)<>M4, M4<M3, M3<>L3, M4<>L4, SUM($G$2:$G$9)<=0), "CHECK INPUTS", SUMPRODUCT(--($D$2:$D$9>=M3), --($D$2:$D$9<=M4))))
Copy L6:L13 into M6:M13. Then make two edits: in M8, change $H$2:$H$9 to $I$2:$I$9, and in M13, change " WITHIN-WINDOW (" to " RETURNING (".
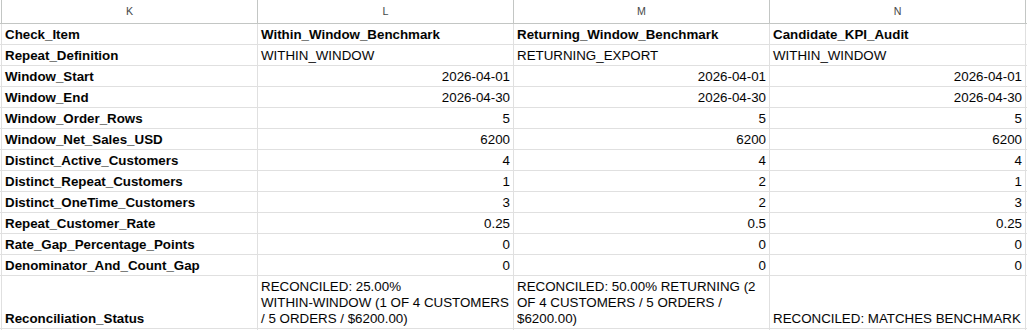
L13 should read RECONCILED: 25.00% WITHIN-WINDOW (1 OF 4 CUSTOMERS / 5 ORDERS / $6200.00), and M13 RECONCILED: 50.00% RETURNING (2 OF 4 CUSTOMERS / 5 ORDERS / $6200.00).
To check that later orders don’t leak into an earlier period, set L3 and M3 to 2026-01-01 and L4 and M4 to 2026-03-31. Both statuses change to 0.00% (0 OF 3 CUSTOMERS / 3 ORDERS / $3400.00), because nobody ordered twice in Q1. Then set L3 and M3 back to 2026-04-01 and L4 and M4 back to 2026-04-30.
Column N audits a number someone else reports, such as a dashboard card or a colleague’s spreadsheet. Enter its definition in N2, its window in N3:N4, and its counts and rate in N5:N10. Type the rate as a decimal: 0.25, not 25. In N11:
=IF(OR(EXACT(L13, "CHECK INPUTS"), EXACT(M13, "CHECK INPUTS"), NOT(OR(N2="", EXACT(N2, "NOT TESTED"), EXACT(N2, "WITHIN_WINDOW"), EXACT(N2, "RETURNING_EXPORT"))), IF(ISNUMBER(N3), OR(N3<DATE(2000,1,1), INT(N3)<>N3), NOT(OR(N3="", EXACT(N3, "NOT TESTED")))), IF(ISNUMBER(N4), OR(N4<DATE(2000,1,1), INT(N4)<>N4), NOT(OR(N4="", EXACT(N4, "NOT TESTED")))), IF(AND(ISNUMBER(N3), ISNUMBER(N4)), N4<N3, FALSE), IF(ISNUMBER(N5), OR(N5<=0, INT(N5)<>N5), NOT(OR(N5="", EXACT(N5, "NOT TESTED")))), IF(ISNUMBER(N6), N6<=0, NOT(OR(N6="", EXACT(N6, "NOT TESTED")))), IF(ISNUMBER(N7), OR(N7<=0, INT(N7)<>N7), NOT(OR(N7="", EXACT(N7, "NOT TESTED")))), IF(ISNUMBER(N8), OR(N8<0, INT(N8)<>N8), NOT(OR(N8="", EXACT(N8, "NOT TESTED")))), IF(ISNUMBER(N9), OR(N9<0, INT(N9)<>N9), NOT(OR(N9="", EXACT(N9, "NOT TESTED")))), IF(ISNUMBER(N10), OR(N10<0, N10>1), NOT(OR(N10="", EXACT(N10, "NOT TESTED"))))), "CHECK INPUTS", IF(OR(N2="", EXACT(N2, "NOT TESTED"), NOT(ISNUMBER(N3)), NOT(ISNUMBER(N4)), NOT(ISNUMBER(N5)), NOT(ISNUMBER(N6)), NOT(ISNUMBER(N7)), NOT(ISNUMBER(N8)), NOT(ISNUMBER(N9)), NOT(ISNUMBER(N10))), "NOT TESTED", ROUND((N10 - IF(EXACT(N2, "WITHIN_WINDOW"), L10, M10))*100, 2)))
N11 is the rate gap in percentage points against the matching benchmark. N12 adds up how far the reported active, repeat, and one-time counts are from the benchmark:
=IF(EXACT(N11, "CHECK INPUTS"), "CHECK INPUTS", IF(EXACT(N11, "NOT TESTED"), "NOT TESTED", ABS(N7 - IF(EXACT(N2, "WITHIN_WINDOW"), L7, M7)) + ABS(N8 - IF(EXACT(N2, "WITHIN_WINDOW"), L8, M8)) + ABS(N9 - IF(EXACT(N2, "WITHIN_WINDOW"), L9, M9))))
N13 checks the window first, then the denominator, then whether the parts add up, then the definition:
=IF(OR(EXACT(N11, "CHECK INPUTS"), EXACT(N12, "CHECK INPUTS")), "CHECK INPUTS", IF(OR(EXACT(N11, "NOT TESTED"), EXACT(N12, "NOT TESTED")), "NOT TESTED: ENTER CANDIDATE KPI VALUES", IF(OR(N3<>L3, N4<>L4, N5<>L5, ROUND(N6-L6, 2)<>0), "STOP: WINDOW BOUNDARY MISMATCH (CHECK START/END DATES)", IF(N7<>L7, "STOP: DENOMINATOR GRAIN MISMATCH (USE DISTINCT CUSTOMERS NOT ORDERS)", IF(N8+N9<>N7, "STOP: REPEAT NUMERATOR NOT DEDUPLICATED (REPEAT + ONE-TIME <> ACTIVE CUSTOMERS)", IF(OR(N12<>0, ROUND(N11, 2)<>0, ROUND(N10 - ROUND(N8/N7, 4), 4)<>0), "STOP: REPEAT COUNT OR RATE MISMATCH VS SELECTED DEFINITION", "RECONCILED: MATCHES BENCHMARK"))))))
With N2 still NOT TESTED, N13 says NOT TESTED: ENTER CANDIDATE KPI VALUES. Now test the traps by entering each row below into N2:N10. Enter every cell for each test, because Trap 1 and Trap 2 differ only in N3:N6. Trap 1 starts at the first order in the export, so it uses N3 = 2026-02-14, N4 = 2026-04-30, N5 = 8, and N6 = 9600. Every other test uses N3 = 2026-04-01, N4 = 2026-04-30, N5 = 5, and N6 = 6200.
| Test | N2 | N3:N6 | N7 | N8 | N9 | N10 | N11 | N13 result (shortened) |
|---|---|---|---|---|---|---|---|---|
| Trap 1 | WITHIN_WINDOW | Feb 14 to Apr 30, 8, 9600 | 5 | 2 | 3 | 0.40 | 15 | STOP: WINDOW BOUNDARY MISMATCH |
| Trap 2 | WITHIN_WINDOW | Apr 1 to Apr 30, 5, 6200 | 5 | 2 | 3 | 0.40 | 15 | STOP: DENOMINATOR GRAIN MISMATCH |
| Trap 3 | WITHIN_WINDOW | Apr 1 to Apr 30, 5, 6200 | 4 | 2 | 3 | 0.50 | 25 | STOP: REPEAT NUMERATOR NOT DEDUPLICATED |
| Trap 4 | WITHIN_WINDOW | Apr 1 to Apr 30, 5, 6200 | 4 | 2 | 2 | 0.50 | 25 | STOP: REPEAT COUNT OR RATE MISMATCH |
| Correct A | WITHIN_WINDOW | Apr 1 to Apr 30, 5, 6200 | 4 | 1 | 3 | 0.25 | 0 | RECONCILED: MATCHES BENCHMARK |
| Correct B | RETURNING_EXPORT | Apr 1 to Apr 30, 5, 6200 | 4 | 2 | 2 | 0.50 | 0 | RECONCILED: MATCHES BENCHMARK |
The full STOP messages are in the N13 formula above.
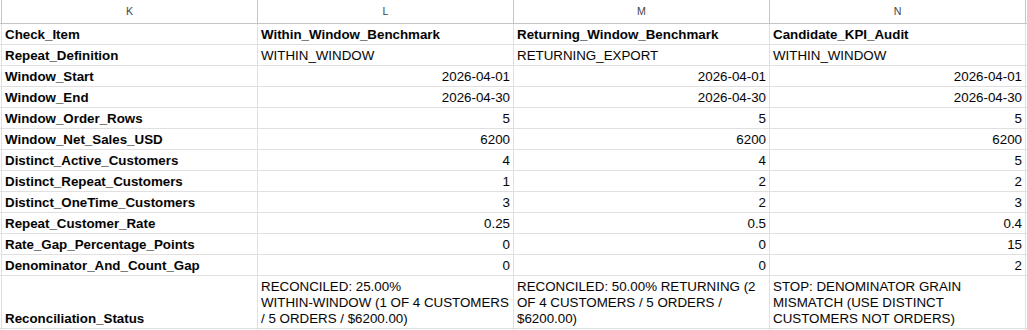
With Correct A entered, try typing 25 instead of 0.25 in N10. The audit column returns CHECK INPUTS, and L13 and M13 stay reconciled. Change N10 back to 0.25 when you’re done.
Adapting the Sheet to Your Own Export
These formulas are written for eight rows. For your file:
- Copy F2:I2 down to your last order row, and extend every
$2:$9range to that row. The growing ranges in G2 ($B$2:B2and$D$2:D2) stay anchored at row 2 and extend on their own. - Replace the
8in each row-count check with your number of order rows. These areCOUNTIF($F$2:$F$9, "OK")<8in G2 and L5,COUNT($G$2:$G$9)<8in H2, I2, and L5, andCOUNT($H$2:$H$9)<8andCOUNT($I$2:$I$9)<8in L5. Don’t use find-and-replace on 8: F2 also uses 8 for the ID length and character positions. - Change or remove the ORD- and CUST- format checks in F2 to match your platform’s IDs.
- On exports with thousands of rows, column G gets slow. A pivot table of customers by order count is a practical cross-check.
In Google Sheets, =UNIQUE(FILTER(B2:B9, (D2:D9>=L3)*(D2:D9<=L4))) lists the four April customers, and =COUNTUNIQUEIFS(B2:B9, D2:D9, ">="&L3, D2:D9, "<="&L4) counts them. Avoid COUNTUNIQUE(FILTER(...)) for this. When no rows match, FILTER returns an error, and COUNTUNIQUE counts that error as one customer. Excel has no COUNTUNIQUE, so the helper columns are the version that works in both.
Checklist Before You Report the Number
- F2:F9 all say
OK, and every amount is above zero. - The report header names the definition: within-window repeat or returning customer.
- Repeat plus one-time customers equals active customers (L8 + L9 = L7).
- The order dates and the window dates in L3:M4 are real dates, not text.
- No customer appears under two IDs or two names. Column F catches name and ID conflicts, so check new customer IDs for duplicate accounts too.
What to Do Next
If the reported repeat rate still doesn’t match a dashboard, why the dashboard total differs from the spreadsheet walks through the same kind of reconciliation for totals. If your order rows came from joining two tables, check why merging tables inflates your sales total before you count anything.