 John Serra
One row represents whatever the report was built to record, and that choice is called the table’s grain. In an order-level export, one row is one whole order. In an order-line export, one row is one line item within an order. You need to know which one you have before you write a formula, because if the full order total repeats on every line, summing that column counts orders with several lines more than once.
The error is easy to make and hard to see. The numbers look like numbers, the total looks plausible, and nothing in the spreadsheet warns you.
Order Grain and Order-Line Grain
Think of a receipt. An order-level table is a stack of receipts with one slip per checkout and a final total on each. An order-line table is the itemized tape on one receipt, where every sandwich, coffee, and pastry gets its own line.
The grain also tells you which column should be unique. At order grain, the Order ID should appear once per row. At order-line grain, the Order ID repeats whenever an order has more than one line, so uniqueness comes from a pair: the Order ID plus a line number.
Data modelers call this declaring the grain, and the Kimball Group’s dimensional modeling guidance on grain makes it the first decision, before you pick what to measure or how to slice it. Orders and order lines are the most common sales formats, but an export can also record shipments, payments, or periodic snapshots. The first step is always the same: decide what one row means.
The Double-Counting Trap
Here is a made-up export with three rows. Its structure matches what many order-line reports look like. Put the table in a worksheet with the headings in row 1, starting at A1, so Order_ID is in column B, and Line_ID is in column C. The formulas below use those cells.
| Row | Order_ID | Line_ID | Customer | Item_SKU | Quantity | Unit_Price | Line_Amount | Order_Total |
|---|---|---|---|---|---|---|---|---|
| 1 | ORD-101 | 1 | Acme Corp | Widget Alpha | 1 | $20.00 | $20.00 | $50.00 |
| 2 | ORD-101 | 2 | Acme Corp | Widget Beta | 1 | $30.00 | $30.00 | $50.00 |
| 3 | ORD-102 | 1 | Beta LLC | Widget Gamma | 2 | $20.00 | $40.00 | $40.00 |
There are two orders but three rows. Order ORD-101 has two lines, and the report repeated its $50 order total on both.
Sum the Line_Amount column and you get $20 + $30 + $40 = $90.00. That is the real sales subtotal. Sum the Order_Total column instead and you get $50 + $50 + $40 = $140.00. The second number is $50 too high, an overstatement of about 56%, because ORD-101’s $50 was added twice.
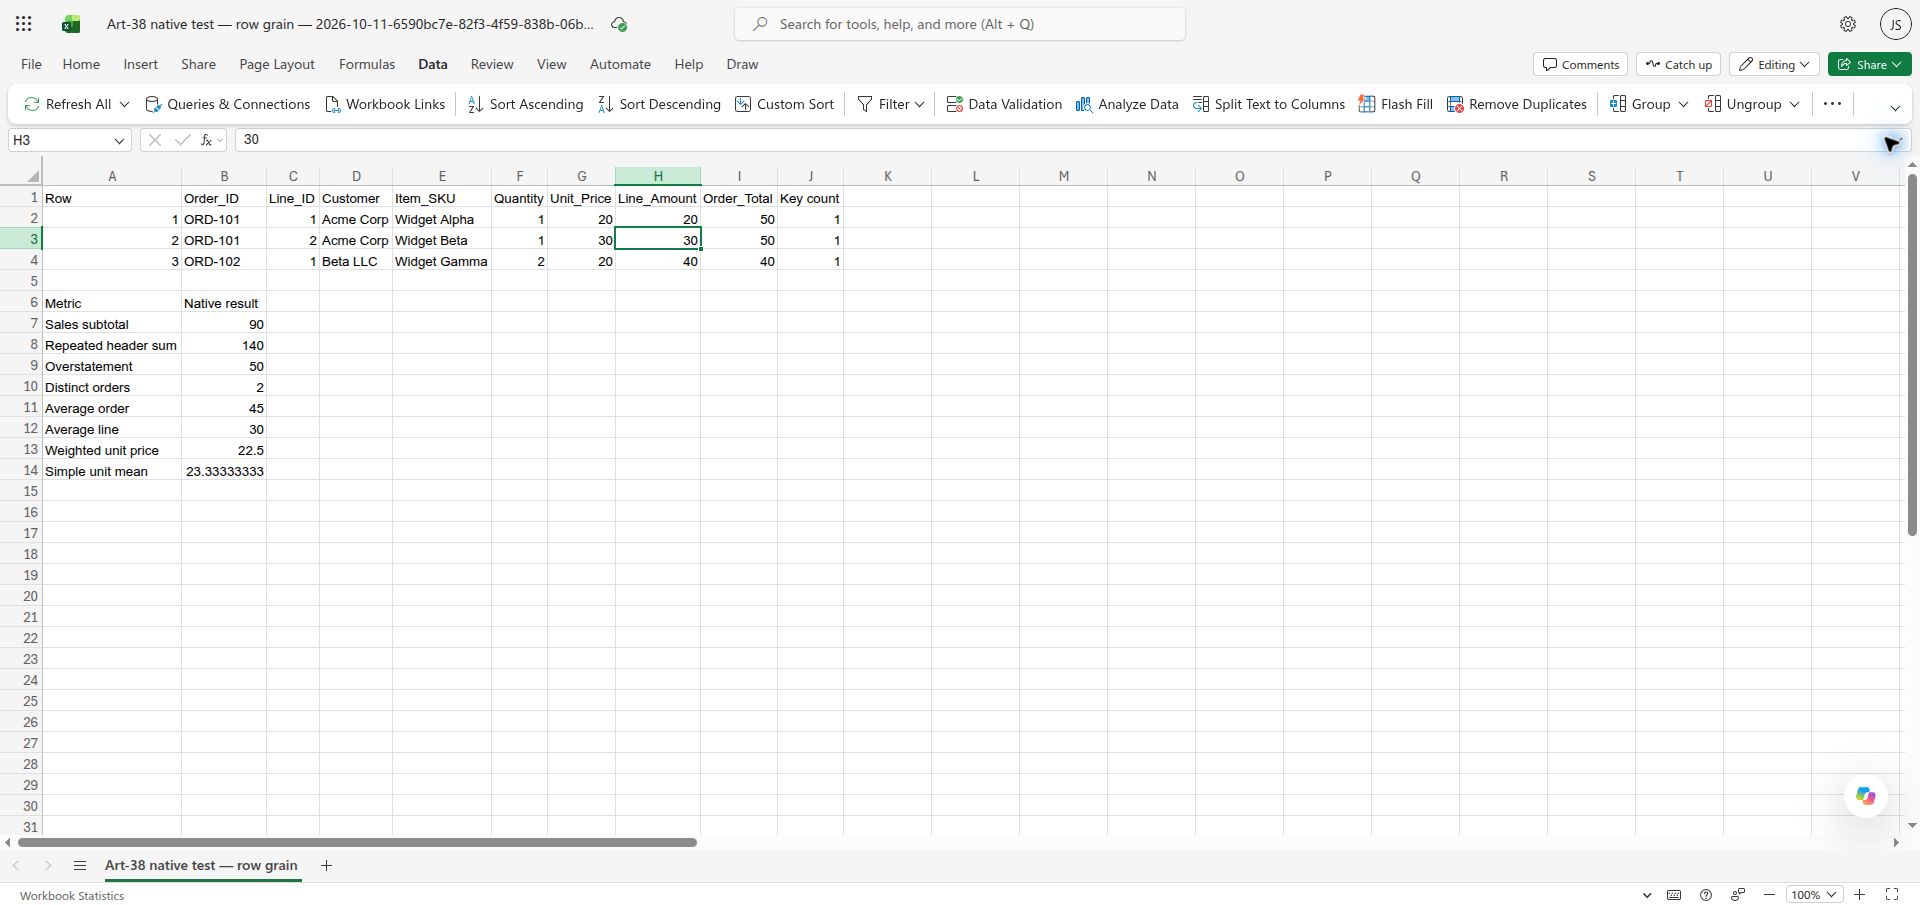
Some systems repeat order-level fields on every line. Others, such as Shopify’s order export, according to its help documentation, list each line item on its own row and leave the order-level fields blank after the first line. Neither is a mistake by the person who exported the file. It is a formatting choice, and you have to read it before you trust a total.
A quick rule for which columns you can add up across rows:
- Usually safe to sum: line-level amounts in one currency, such as Line_Amount, and quantities in compatible units, because each row holds its own share.
- Not safe to sum: Unit_Price, discount percentages, tax rates, and any order-level total repeated across lines.
A Three-Step Check for Your Own Export
1. Read the report’s definition. Look at how the export was created. Was it an order summary or an itemized line-item report? Columns such as Line_Number, SKU, or Quantity point to line-level rows, but they are clues, not proof.
2. State your guess and test the key. Write down what you expect, such as “one row per order line, and Order ID plus Line ID is unique.” First, see whether Order IDs repeat. In Google Sheets, compare =COUNTA(B2:B4) with =COUNTUNIQUE(B2:B4). In Excel 365 or Excel 2021 and later, compare =COUNTA(B2:B4) with =COUNTA(UNIQUE(B2:B4)). In this example, that is 3 against 2, so IDs repeat. Repeating IDs suggest multi-line orders but do not prove it, because duplicate imports, split shipments, and multiple payments can repeat IDs too.
Then test the pair. Both parts of the key must be filled in and free of errors on every row first. Limiting the range to the populated rows doesn’t guarantee that, so leave any row with a missing or broken ID unresolved. In a helper column, enter this in the first data row and fill it down all three rows:
=COUNTIFS($B$2:$B$4, B2, $C$2:$C$4, C2)
It works in Google Sheets and in Excel, including Excel 2016 and 2019. In this example, it returns 1, 1, 1, which means each Order ID and Line ID pair appears once. If any row returns 2 or more, a pair is repeated. Investigate before you change anything. It could be a duplicate export, a split shipment, or a data entry error, and the count alone cannot say which.
Use exact ranges for the rows that hold data. A range that runs far past your last row includes blank cells and distorts the comparison.
3. Compare to the source system’s subtotal. Sum your Line_Amount column and compare it with a sales subtotal produced by the source system for the same orders, currency, and dates. If they match, the structure and the column you chose are probably right. If they do not, stop and find out why.
Do not use your bank deposit for this check. Deposits differ from sales because of processing fees, sales tax, refunds, and timing. Why your business numbers don’t match across systems covers that comparison.
Reporting From an Order-Line Table
If you want total sales, stay in the line-level table and sum Line_Amount. You don’t need to collapse it into one row per order first.
Averages depend on what you divide by, and the example shows three different answers from the same $90:
- Average order value: $90 ÷ 2 orders = $45.00.
- Average line amount: $90 ÷ 3 lines = $30.00.
- Average unit price paid, weighted by quantity: $90 ÷ 4 units = $22.50.
If you average the Unit_Price column directly, you get $23.33, the plain mean of the three recorded line prices. That is a legitimate number, but it treats the one-unit and two-unit lines alike, so it is not the average price a customer paid per unit. Pick the average that matches your question.
For order-level numbers such as order count or average order value, avoid quick tricks like taking the maximum order total in a pivot table unless you have checked that the repeated totals agree on every line. It is usually safer to count distinct Order IDs, or to export an order-level summary from the source system.
Frequently Asked Questions
Can an export have unique Order IDs and still be one row per line?
Yes. If every order in the export has exactly one line, each Order ID will appear once even though the table is built at line grain. Grain describes what a row is meant to record, not what a particular batch of data happens to look like.
Why shouldn’t I check my spreadsheet against my bank deposit?
Deposits are net of fees, may exclude or include tax differently, reflect refunds, and arrive on the processor’s schedule. Compare against a sales subtotal from the same source system instead.
What happens if I use Remove Duplicates on Order ID?
In an order-line table, Excel keeps the first row for each Order ID and deletes the rest, so any order with several lines loses all but one. Your working file then understates sales. Keep an untouched copy of the original export, and test the Order ID and Line ID pair before you remove anything.
Next Step
Once you know what a row represents, the rest of your analysis gets easier to trust. For a wider check on missing values, date formats, and control totals before you present numbers, use The Small Business Data Audit Checklist.