
When a Data Studio report connected to Google Sheets shows old data, start with four checks. Confirm the sheet edit was saved and the connector’s Optional Range covers every row. Check the report’s date filters. Then click More options > Refresh data, because Sheets queries can be served from a cache for up to 15 minutes by default. New columns also need Refresh fields.
Data Studio was called Looker Studio from October 2022 until April 2026, so you will see both names (Welcome to Data Studio). I prefer Google Sheets because a spreadsheet should be shareable, whether you use it to collaborate or to communicate, and connecting it needs no additional BI subscription in an existing Google workflow. I have seen numbers fall out of sync across connected tools plenty of times. Checking the sheet, the filters, and the cache in that order helps separate a range or filter problem from a cache delay.
The Example Sheet
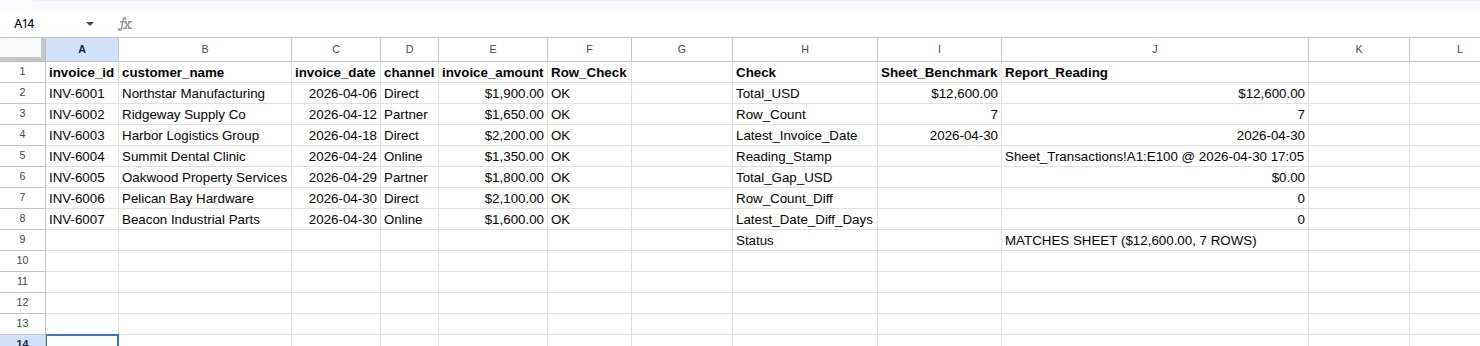
Here is a made-up April 2026 invoice ledger on a tab named Sheet_Transactions. Five invoices worth $8,900.00 were entered through April 29, and two more worth $3,700.00 were added at month-end close on April 30: $12,600.00 across seven rows. Columns A to E are the raw data you connect, and column F is a row check. The Row column is a row-number guide.
Enter C2:C8 as real dates, such as =DATE(2026,4,6) in C2, formatted yyyy-mm-dd. Enter the seven amounts in E2:E8 as plain numbers (1900, not “$1,900”), formatted as currency. Confirm =COUNT(C2:C8) and =COUNT(E2:E8) both return 7.
| Row | invoice_id (A) | customer_name (B) | invoice_date (C) | channel (D) | invoice_amount (E) | Row_Check (F) |
|---|---|---|---|---|---|---|
| 2 | INV-6001 | Northstar Manufacturing | 2026-04-06 | Direct | $1,900.00 | OK |
| 3 | INV-6002 | Ridgeway Supply Co | 2026-04-12 | Partner | $1,650.00 | OK |
| 4 | INV-6003 | Harbor Logistics Group | 2026-04-18 | Direct | $2,200.00 | OK |
| 5 | INV-6004 | Summit Dental Clinic | 2026-04-24 | Online | $1,350.00 | OK |
| 6 | INV-6005 | Oakwood Property Services | 2026-04-29 | Partner | $1,800.00 | OK |
| 7 | INV-6006 | Pelican Bay Hardware | 2026-04-30 | Direct | $2,100.00 | OK |
| 8 | INV-6007 | Beacon Industrial Parts | 2026-04-30 | Online | $1,600.00 | OK |
The F values are what this formula returns, not values to type. Enter it in F2 and fill it down to F100:
=IF(COUNTA(A2:E2)=0, "", IF(OR(TRIM(A2)="", TRIM(B2)="", NOT(ISNUMBER(C2)), TRIM(D2)="", NOT(ISNUMBER(E2))), "CHECK INPUTS", IF(OR(C2<DATE(2000,1,1), INT(C2)<>C2, E2<0, SUMPRODUCT(--($A$2:$A$100=A2))>1), "CHECK INPUTS", "OK")))
F2 stays blank on an empty row and returns "OK" for a valid one. It returns "CHECK INPUTS" for a missing field, a non-numeric or negative amount, a text or time-stamped date, or a repeated invoice ID. The ID check compares plain text, ignoring case, so *, ?, and ~ in an ID are not read as wildcards.
Checks 1 and 2: The Sheet and the Optional Range
- Unsaved edits. A value typed into
E8is not saved until you pressEnterorTab. Until then, Data Studio reads the old value. - A clipped Optional Range. Open Resource > Manage added data sources, click Edit, then Edit connection (Google Sheets connector). If Optional Range reads
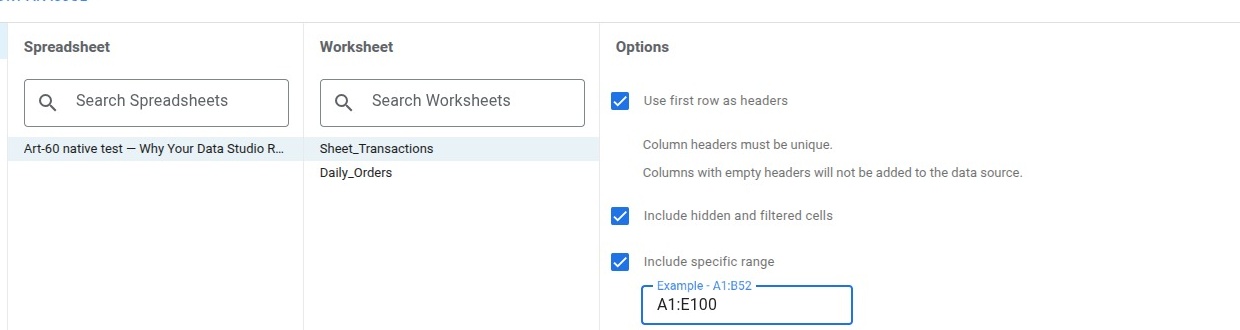
A1:E7, the report stops at row 7. It shows $11,000.00 across six rows:INV-6006($2,100.00, April 30) is in, butINV-6007($1,600.00) and every later row is cut off. Refresh data cannot fix this.
Set Optional Range to A1:E100. That connects only the raw columns and keeps column F and the check block in H1:J9 out of the report. It is a bounded range, so it covers new rows only through row 100. Before your data reaches row 101, extend the connector range, the column F fill, and the $2:$100 ranges in F2 and I2:I4. Google’s connector guide shows bounded ranges, so this check avoids open-ended ones such as A1:E.
Check 3: Report Date Filters
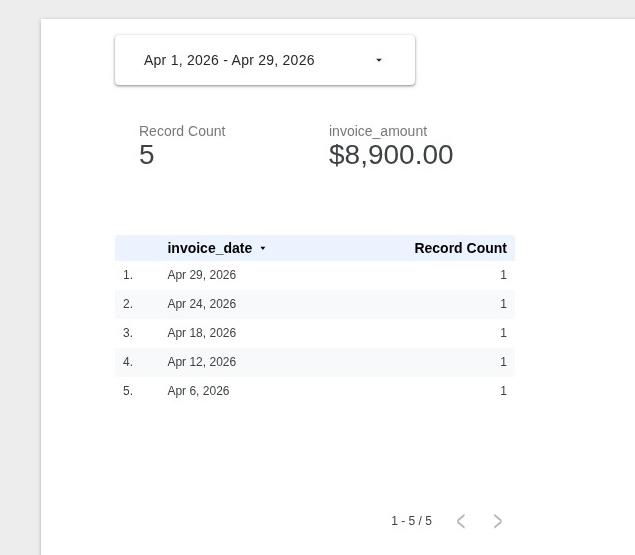
If the report shows $8,900.00, five rows, and a latest date of April 29, the April 30 rows are missing. A date control or chart date range that ends on April 29 produces exactly the same numbers as a stale cache. Refreshing will not bring them back, so check the page date control and each chart’s Default date range first.
Check 4: The Cache and Refresh Data
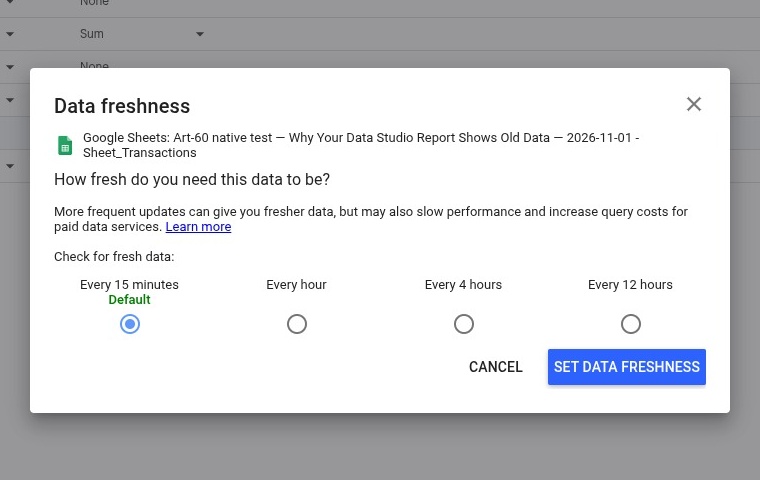
Per Manage data freshness, the Google Sheets connector’s default Data freshness setting is 15 minutes. Editors can change it to 1, 4, or 12 hours under Resource > Manage added data sources > Edit > Data freshness.
- A query the report already ran may be answered from the cache within that window, though Google does not guarantee the full 15 minutes.
- A new query, such as one from changing a filter, goes to the sheet.
- Reloading the browser tab (
F5orCtrl+R) does not bypass the cache, though it can show fresh data if the window has passed or nothing was cached. - On an ordinary standalone report without automatic refresh, an open tab does not redraw by itself.
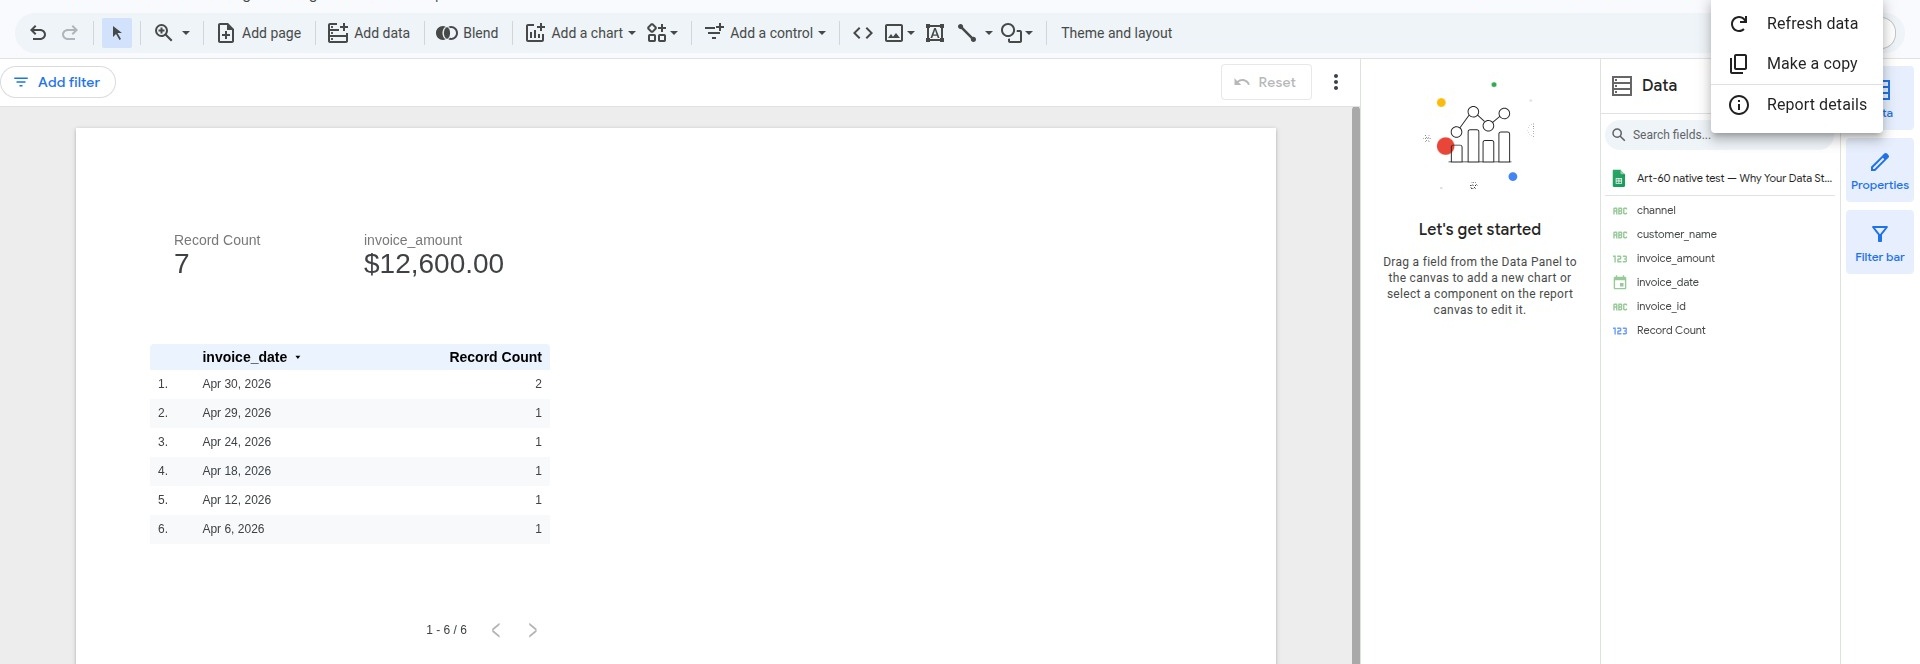
- More options > Refresh data in the editor toolbar refreshes every data source on the report. Every manual refresh method has a one-minute cooldown.
- Refresh data picks up changed values and new rows inside the connected range. If you add or rename a header in row 1, open the data source and click Refresh fields. Neither button expands a clipped Optional Range.
Compare the Report to the Sheet
Build this check block in Sheet_Transactions!H1:J9, outside the connected range. Column I calculates what the report should show, column J holds what you read off it, and rows 6 to 9 compare them. The J values are expected readings for this made-up example; enter your own.
| Row | Check (H) | Sheet_Benchmark (I) | Report_Reading (J) |
|---|---|---|---|
| 2 | Total_USD | $12,600.00 | $12,600.00 |
| 3 | Row_Count | 7 | 7 |
| 4 | Latest_Invoice_Date | 2026-04-30 | 2026-04-30 |
| 5 | Reading_Stamp | Sheet_Transactions!A1:E100 @ 2026-04-30 17:05 | |
| 6 | Total_Gap_USD | $0.00 | |
| 7 | Row_Count_Diff | 0 | |
| 8 | Latest_Date_Diff_Days | 0 | |
| 9 | Status | MATCHES SHEET ($12,600.00, 7 ROWS) |
Each label before = names the destination cell; paste only the formula. Format I4 as yyyy-mm-dd.
I2: =IF(OR(COUNTIF($F$2:$F$100, "OK")=0, COUNTIF($F$2:$F$100, "CHECK INPUTS")>0), "CHECK INPUTS", ROUND(SUM($E$2:$E$100), 2))
I3: =IF(ISNUMBER(I2), COUNTIF($F$2:$F$100, "OK"), "CHECK INPUTS")
I4: =IF(ISNUMBER(I2), MAX($C$2:$C$100), "CHECK INPUTS")
J6: =IF(AND(ISNUMBER(I2), ISNUMBER(J2)), ROUND(J2 - I2, 2), "CHECK INPUTS")
J7: =IF(AND(ISNUMBER(I3), ISNUMBER(J3)), IF(OR(J3<0, INT(J3)<>J3), "CHECK INPUTS", J3 - I3), "CHECK INPUTS")
J8: =IF(AND(ISNUMBER(I4), ISNUMBER(J4)), IF(OR(J4<DATE(2000,1,1), INT(J4)<>J4), "CHECK INPUTS", J4 - I4), "CHECK INPUTS")
J9: =IF(OR(NOT(ISNUMBER(J6)), NOT(ISNUMBER(J7)), NOT(ISNUMBER(J8)), TRIM(J5)=""), "CHECK INPUTS", IF(AND(J6=0, J7=0, J8=0), "MATCHES SHEET ($" & TEXT(J2, "#,##0.00") & ", " & J3 & " ROWS)", "STOP: REPORT GAP " & IF(J6<0, "-$", IF(J6>0, "+$", "$")) & TEXT(ABS(J6), "#,##0.00") & " (" & IF(J7>0, "+", "") & J7 & " ROWS, " & IF(J8>0, "+", "") & J8 & " DAYS)"))
Any "CHECK INPUTS" row in column F stops the whole block.
To fill column J, read the report with the data source and filters your team uses. Add Scorecards for invoice_amount (Sum) and Record Count, and a Table of invoice_date sorted descending; its first row is the latest date. Give all three the same date range and filters. On the total, uncheck Compact numbers and set Decimal precision to 2, so you read $12,600.00, not 12.6K. Then enter:
J2: the total as a plain number (12600).J3: the record count as a whole number (7).J4: the latest date as a real date, such as=DATE(2026,4,30). A typed text label returns"CHECK INPUTS".J5: your own connected range and reading time, not the example’s.
Row 9 shows "CHECK INPUTS" until all four are filled.
What the Gap Pattern Tells You
Each mismatch leaves a different pattern in rows 6 to 8:
| Report reading | Status in J9 |
Where to look first |
|---|---|---|
| $8,900.00, 5 rows, April 29 | STOP: REPORT GAP -$3,700.00 (-2 ROWS, -1 DAYS) | The newest rows are missing: date filters (Check 3), then Refresh data (Check 4) |
| $11,000.00, 6 rows, April 30 | STOP: REPORT GAP -$1,600.00 (-1 ROWS, 0 DAYS) | The bottom row is missing but the latest date matches: Optional Range (Check 2) |
$12,600.00 after E2 changed to 2000 |
STOP: REPORT GAP -$100.00 (0 ROWS, 0 DAYS) | Same rows, changed value: an unsaved edit or a cached query (Checks 1 and 4) |
| $12,600.00 and 8 rows | STOP: REPORT GAP $0.00 (+1 ROWS, 0 DAYS) | The report counts a row the sheet does not: confirm the data source’s spreadsheet, tab, and range |
These patterns show where to look first, not the cause. A range clipped higher up would also push the latest date back.
Run Three Tests, Then Reset
Run these on a copy. Start each test from the baseline: refresh at least a minute after the last refresh, re-enter all four readings in J2:J5, and confirm J9 reads MATCHES SHEET ($12,600.00, 7 ROWS).
- Edited value. Change
E2from 1900 to 2000.I2becomes $12,700.00. If the report still reads $12,600.00,J9showsSTOP: REPORT GAP -$100.00 (0 ROWS, 0 DAYS). After Refresh data and new readings,J9should readMATCHES SHEET ($12,700.00, 7 ROWS). If the report already showed $12,700.00, it returned the updated value and no stale result appeared. SetE2back to 1900. - New row. Enter all five fields in
A9:E9:INV-6008,Crescent Field Services,=DATE(2026,4,30),Direct, and 1400. A blank field makesF9andI2return"CHECK INPUTS". With the baseline readings,J9showsSTOP: REPORT GAP -$1,400.00 (-1 ROWS, 0 DAYS). After a refresh, readings of $14,000.00 and 8 rows giveMATCHES SHEET ($14,000.00, 8 ROWS). ClearA9:E9, keeping theF9formula. - Clipped range. Set Optional Range to
A1:E7, reconnect, and refresh. Readings of $11,000.00, 6 rows, and April 30 giveSTOP: REPORT GAP -$1,600.00 (-1 ROWS, 0 DAYS). Set the range back toA1:E100.
After the last test, return to the baseline the same way.
Limits of This Check
A match means the total, row count, and latest date agree, not that every cell is current. Offsetting edits, such as +$90.00 on one invoice and -$90.00 on another, leave all three unchanged. The J5 stamp is your own note, and the sheet cannot verify it. Confirm the spreadsheet, tab, and range in the data source itself.
Frequently Asked Questions
Can viewers refresh the report, or do we need Data Studio Pro?
Viewers can refresh without Pro if an editor turns on Viewer data refresh. On a standalone report, a viewer can right-click a chart and click Refresh data (that chart only) or click a refresh button an editor added for selected charts, groups, or all sources. Viewers of an embedded report cannot refresh manually. Timed automatic refresh (Manage auto refresh) requires Data Studio Pro and edit access, and it does not override the source’s freshness setting.
Do scheduled emails and extracted data sources show live data?
No. Scheduled delivery emails a PDF snapshot from the time it was sent. An extracted data source stays fixed until it is re-extracted or its Auto update schedule runs. Check the extract’s last update before you check the sheet.
What to Do Next
One row per invoice makes the two row counts meaningfully comparable; see What Does One Row Represent in Your Sales Spreadsheet?. For broader discrepancies, read Why Your Business Numbers Don’t Match Across Systems, summarize rows with Build a Monthly Sales Pivot Table in Google Sheets, and track KPIs in How to Build a Monthly KPI Scorecard.